clustering
-
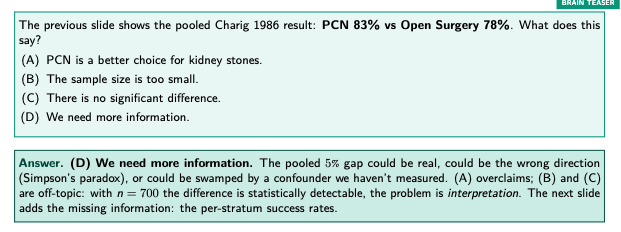
Simpson’s paradox
- a trend that appears in every subgroup of the data reverses (or disappears) when subgroups are pooled due to confounder - a 3rd var that drives both subgroup + outcome
- model trained on aggregate cohort can pick up the wrong sign of an effect if the confounder is unobserved!
-
Patient stratification
- dividing patients into subgroups that will receive same clinical actions - treatment, prognosis, placement
- risk stratification
- treatment stratification
- trial enrichment
- grouping variable is already known (supervised)
- dividing patients into subgroups that will receive same clinical actions - treatment, prognosis, placement
-
disease subtypes
- distinct biological or clinical entitites hiding inside what was thought to be one disease revealed by patterns in measurements!
- molecular
- clinical phenotypes
- pathophysiological
- discovered from data, no subgroup label exists beforehand (unsupervised)
- distinct biological or clinical entitites hiding inside what was thought to be one disease revealed by patterns in measurements!
-
finding subgroups
- dim reduction - pca, t-sne, umap, vae
- clustering - k-means, gmm
-
Dimensionality reduction
- PCA (unsupervised)
- rotated high dim data onto new axis called principal components ordered by amount of variance (or spread) they capture (all PCs are orthogonal to each other)
- standardization - before applying PCA put every feat on same scale using z-score
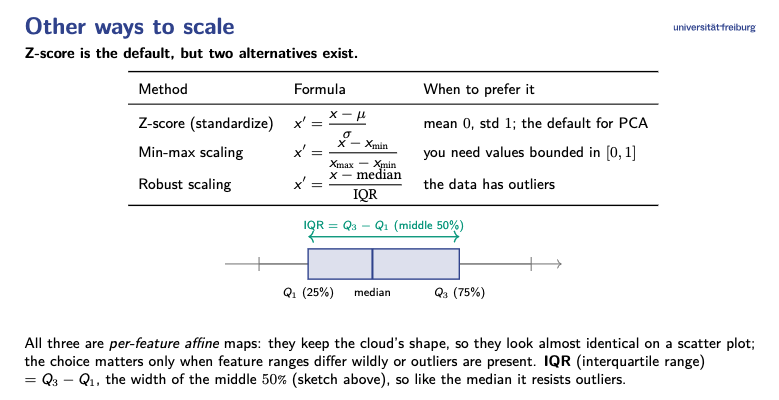
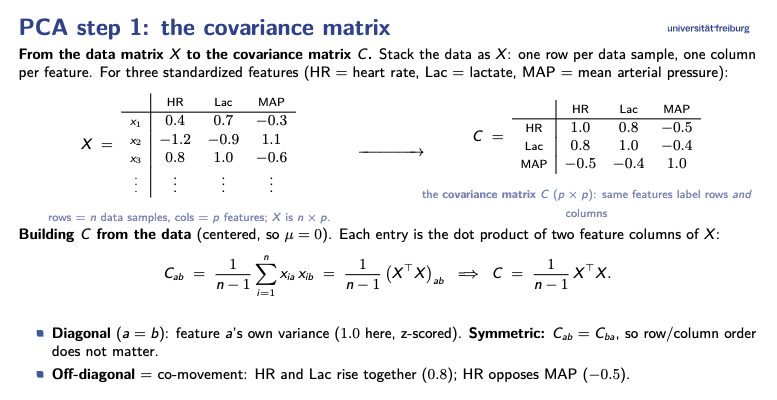
- covariance matrix - captures how different clinical feat move together
- eigenvectors and variance retained
- PCA (unsupervised)
-
Clustering
Links:
202608151734